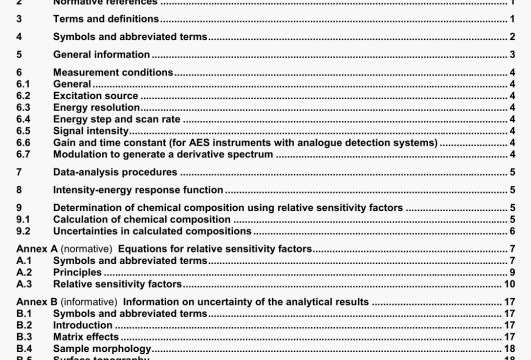
AS ISO 18118 pdf download – Surface chemical analysis-Augerelectron spectroscopy and X-ray photoelectron spectroscopy-Guide tothe use of experimentally determinedrelative sensitivity factors for the quantitative analysis of homogeneous materials.
To obtain a peak area or a peak height from a measured direct spectrum, a background shall be chosen and subtracted from the measured spectrum (see ASTM E 995 iU). The backgrounds most commonly used for this purpose [121 are a linear background, a ShWley background (131 or a Tougaard background [‘4l
In AES, it is often convenient to measure a peak-to-peak height or a peak-to-background height in a differential spectrum. The differential spectrum can be recorded (in analogue detection instruments) or a measured direct spectrum can be numerically differentiated for this purpose. The same numerical procedure and choices shall be made In the differentiation of the spectra for the unknown sample and for the reference samples used to de(ermine the ERSFs[11151. See also 6.7.
NOTE 1 Detale of backgmund-siitrsction piocedures are given r ASTM E 995 lIlt.
NOTE 2 Cetaite of peak attenuation in numericel differentiation and of ttie Savitz*y and Gotay differentiation method m AES . be obtained from References 191 and 110).
NOTE 3 Reference [16) gives information on procedures to obtain consistent results in the use of differentiabon for measurements leth different chemical states of an element. This reference provides simdar intormation for the determination of peak areas
8 Intensity-energy response function
The intensiy-energy response function (IERF) is a measure of the efficiency of the electron-energy ana!yser in transmitting electrons and of the detector system in detecting them as a function of electron energy In general, the IERF wiN change ii the analyser pass energy, retardation ratio and aperture sizes are modified. In addition, different instruments of the same type (end from the same manufacturer) may have different IERFe for the same instrumental settings because the detector efficiency as a function of energy will often change during its service life. As a result, it is recommended that the intensity scale be caibrated at regular Intervals (for example, every six months) using calibration software available from the UK National Physical Laboratory 141 or that ERSFs be measured for selected elements (having Auger-electron or photoelectron peaks over the working range of the energy scale). Such checks should aleo be made if the detector surface has been exposed to any environment that could affect Its efficiency and If lnsiiating films (e.g. from sputtering of non-conductIng samples) have been deposited on analyser surfaces. Local measurements of ERSFs for selected elements shell be recorded in the log book for the instrument and plotted as a function of time so that changes can be easily detected.
9 Determination of chemical composition using relative sensitivity factors
9.1 Calculation of chemical composition
9,1.1 General
The chemical composition of an unknown sample may be determined usWig EQuations (A.5) and (A.6) or one of the other equations given in Annex A Equation (A.6) is commonly used but ignores matrix terms. For some types of relative sensitivity factor, these matrix terms are effectively unity, and may be ignored but, when other types of sensitivity factor are used, the matrix factors may be as high as 8 In AES III and 3 in XPS [2), The accuracy of calculated chemical compositions thus depends significantly on the type of sensitivity factor used. This is discussed in Annex A
Reference [16] shows how differentiation should be performed when measurements are made with different chemical states of an element in order to obtain consistent results- This reference also gives similar information on the determination of peak areas.
8.4 Sample morphology
The composition of a practical sample may vary with position. Possible variations of composition in the plane of the sample can be determried from instruments equipped with focused electron or X-ray beams or with imaging electron optics it the composition changes occur over distances larger than the lateral resolution. Possible variations of composition with depth from the sample surface can be detemuned from analyses of spectra obtained at two or more emission angles 1471 or from analyses of the intensity due to inelastic scattering the vionity of Auger-electron or photoelectron peaks [8].
B.5 Surface topography
The reference samples and, if possible, the unknown samples should have similar surface topographies since the relative intensities at electrons with different energies can change with surface roughness, angle of electron-beam incidence In AES, and particle size.
AS ISO 18118 pdf download – Surface chemical analysis-Augerelectron spectroscopy and X-ray photoelectron spectroscopy-Guide tothe use of experimentally determinedrelative sensitivity factors for the quantitative analysis of homogeneous materials
