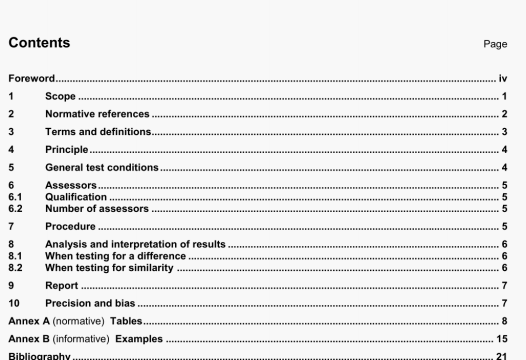
ISO 5495 pdf download – Sensory analysis -Methodology —Paired comparison test.
5.8 The assessors shall be told whether or not they have to follow a special protocol in order to assess the products (e.g. whether or not to swallow the samples for a taste test, or carry out a specific gesture for a tactile test) or whether they are free to do as they please. In this latter case, they should be requested 10 proceed in the same manner for all the samples
5.9 During the test sessions, avoid giving information about product identity, expected treatment effects or individual performance until all tests are completed.
6 Assessors
6.1 Qualification
All assessors should poss wie same level of qualification, this level being chosen on the basis of the test objective (see ISO 8586-1 and ISO 8586-2). Experience and familiarity with the product can increase the performance of an assessor and can consequently increase the likelihood of finding a significant differonce Monitoring the performance of assessors over time may prove to be useful for increased sensitivity,
All assessors shall be familiar with the mechanisms of the paired test (the scoresheet. the task and the evaluation procedure). In addition, assessors shall be capable of recognising the sensory attribute on which the lest is based. This attribute shad be defined verbally, by means of a reference substance or by presenting a few samples having different levels of intensity for the allnbute under examination.
6.2 Number of assessors
Choose the number of assessors so as to obtain the level of sensitivity required for the test (see Table A.4 for a one-sided test and Table A.5 for a two-sided test) The use of a large number of assessors increases the likelihood of detecting small differences between the products. However, in practice, the number of assessors Is often determmed by material conditions (e.g. duration of the experiment, number of available assessors. quantity of product), When conducting a difference test, the number of assessors is typically approximately 24 to 30. When conducting a similarity test, about twice as many assessors (ie. approximately 60) are required for equivalent sensitivity. When testing for similanty, evaluations should not be replicated by the same assessors For a difference test, replications may be considered but should still be avoided whenever possible. However. if replicate evaluations are required in order to produce a sufficient total number of evaluations, every effort should be made to have each assessor perform the same number of replicate evaluations. For example, if only 10 assessors are available, have each assessor perform three paired tests In order to obtain a total of 30 evaluations,
NOTE Analysing three evaluations performed by 10 assessors as 30 ridependent evaluations is not vd when testing for slmdartty uging Table A.3 However, the difterence lest iiong Tables A.1 and %.2 Is valid even when replicate evaluations are performed 151, tel. Some recent publications hi. 121 on repbcated decnmination teats suggest alternative approaches for analysing replicated evaluations.
7 Procedure
7.1 Prepare the worksheets and scorestieels (see Figures B.1. 8.2 and B.3) prior to conducting the test so as to use an equal number of the two possible presentation sequences of both products, A and B.
Use Table k1 to analyse the data obtained from a paired test If the number of correct responses Is greater than or equal to the number given in Table A.1 (corresponding to the number of assessors and to the urisk level chosen for the test), conclude that a perceptible difference exists between the samples (see B. 1).
If desired, calculate a confidence interval on the proportion of the population able to distinguish the samples. This method is described in B.5.
No conclusion should be drawn for maxrium numbers of correct responses under n12
8.1.2 Case of a two-sided test
Use Table A.2 to analyse the data obtained from a paired test. lithe number of consensual responses is greater than or equal to the number given in Table k2 (corresponding to the number of assessors and to the u-risk chosen for the test), conclude that a percepable difference exists between the samples (see B 3).
If desired, calculate a confidence interval on the proportion of the population able to distinguish the samples, This method described in B.5.
8.2 When testing for similarity
8.2.1 Case of a one-s4ded test
Use Table A.3 to analyse the data obtained from a paired test. lithe number of correct responses is less than or equal to the number given In Table A.3 (corresponding to the number of assessors, to the /.risk level and to the value of p chosen for the test), conclude that no meaningful difference exists between the samples (see B.2). If the results are to be compared from one test to another, then the same value OIP,J should be chosen for all tests.
ISO 5495 pdf download – Sensory analysis -Methodology —Paired comparison test
